Netflix EDA
Exploratory Data Analysis of Netflix Titles
Analysis Highlights
Comprehensive Analysis
Deep dive into Netflix's content library with statistical analysis of movies, TV shows, genres, and more.
High-Quality Visualizations
Professional-grade charts with Netflix branding showing trends, distributions, and patterns in content.
Data-Driven Insights
Discover which countries produce the most content, top genres, rating distributions, and growth trends.
Reproducible Research
Well-documented Python code for easy reproduction, modification, and extension of the analysis.
Content Distribution
Movies vs TV Shows
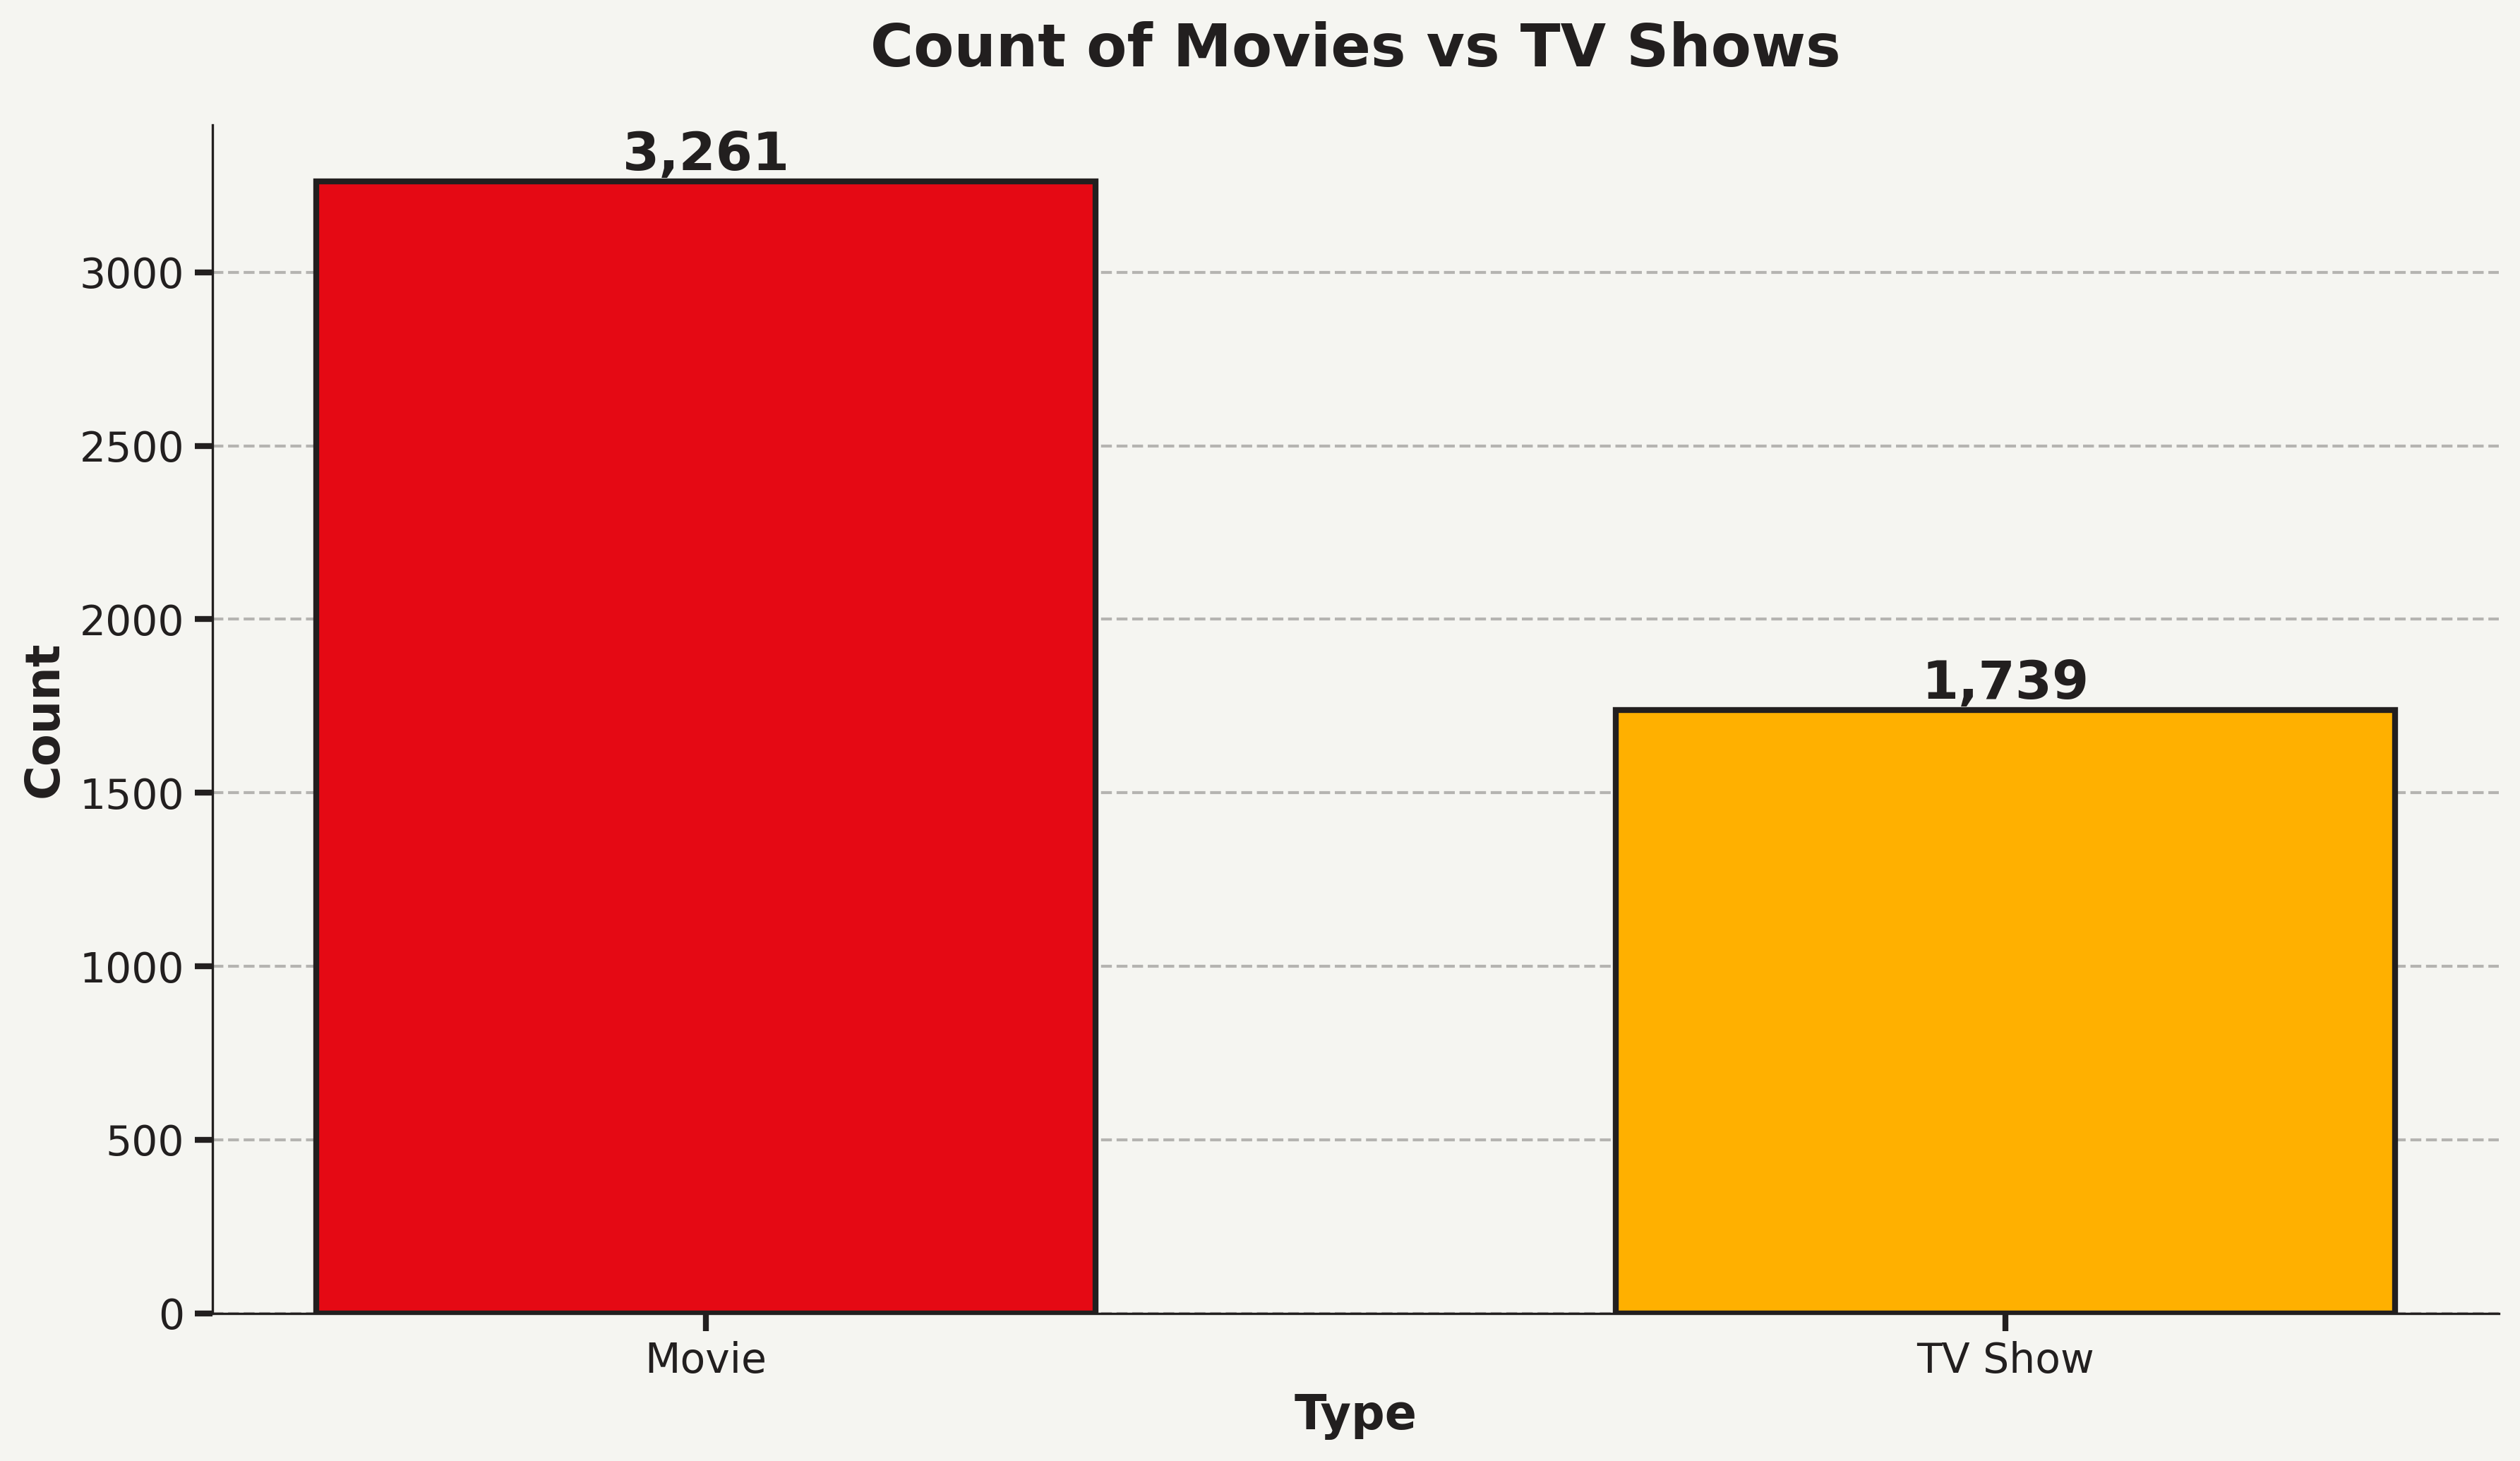
This visualization shows the balance between movies and TV shows in Netflix's catalog. Compare the volume of each content type and understand Netflix's content strategy.
Release Year Trends
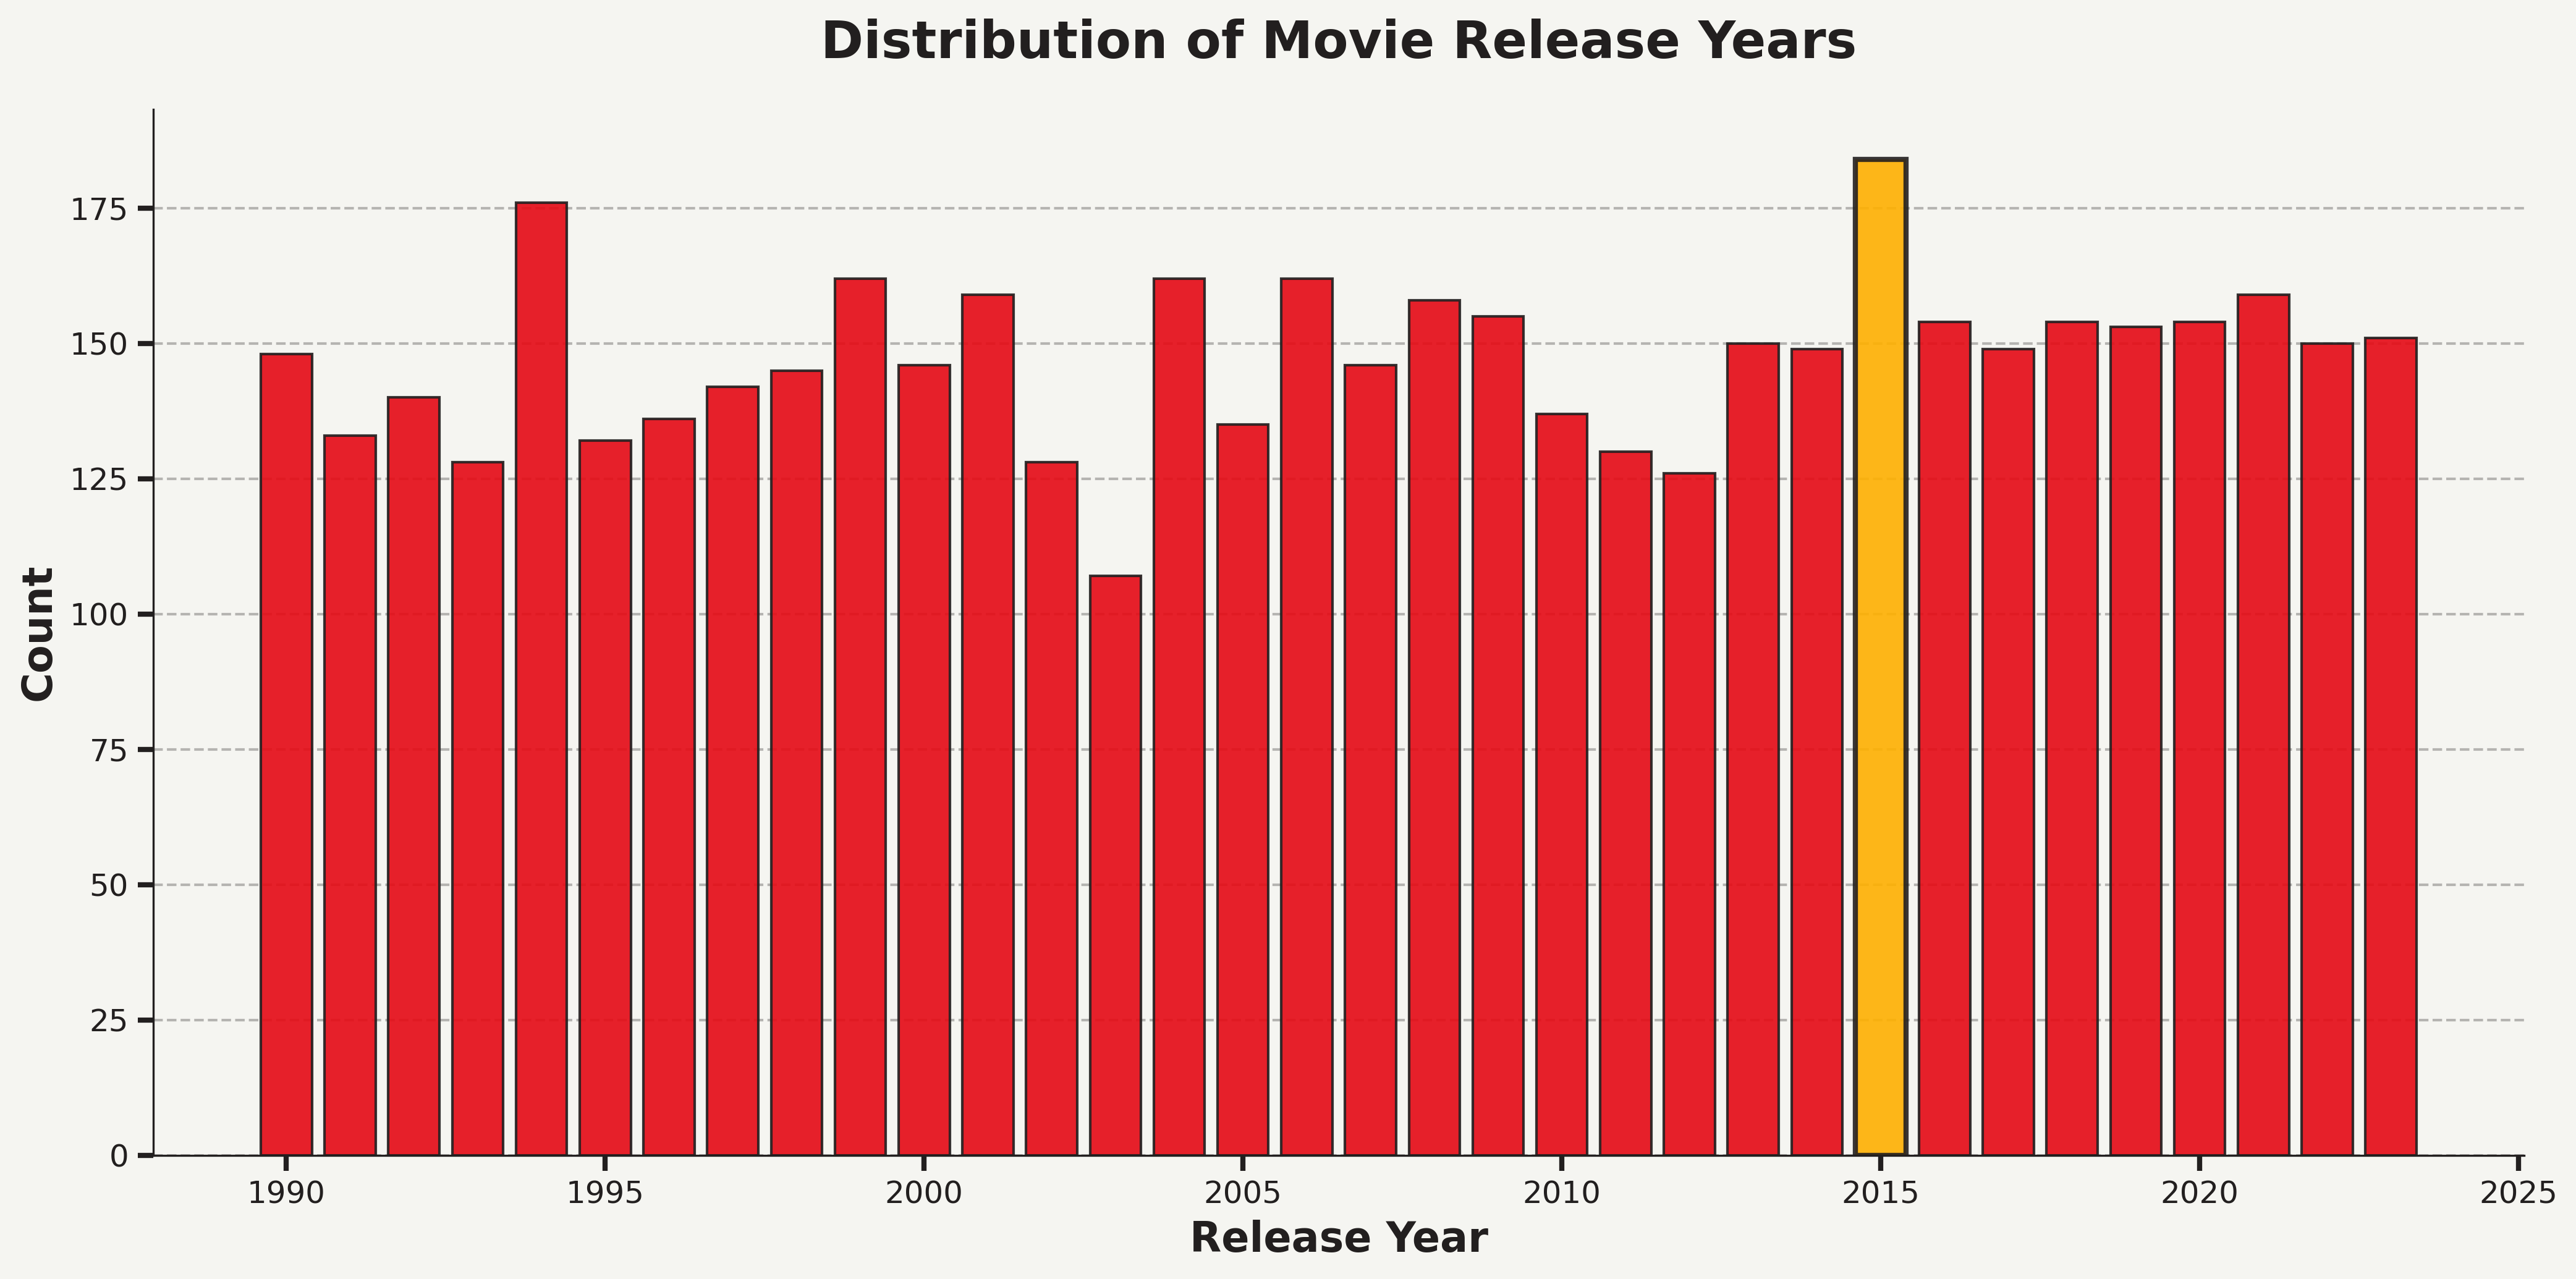
Explore how the release years of content on Netflix are distributed. This reveals Netflix's focus on recent vs. classic content and provides insights into their acquisition strategy.
Genre & Country Analysis
Top 12 Genres
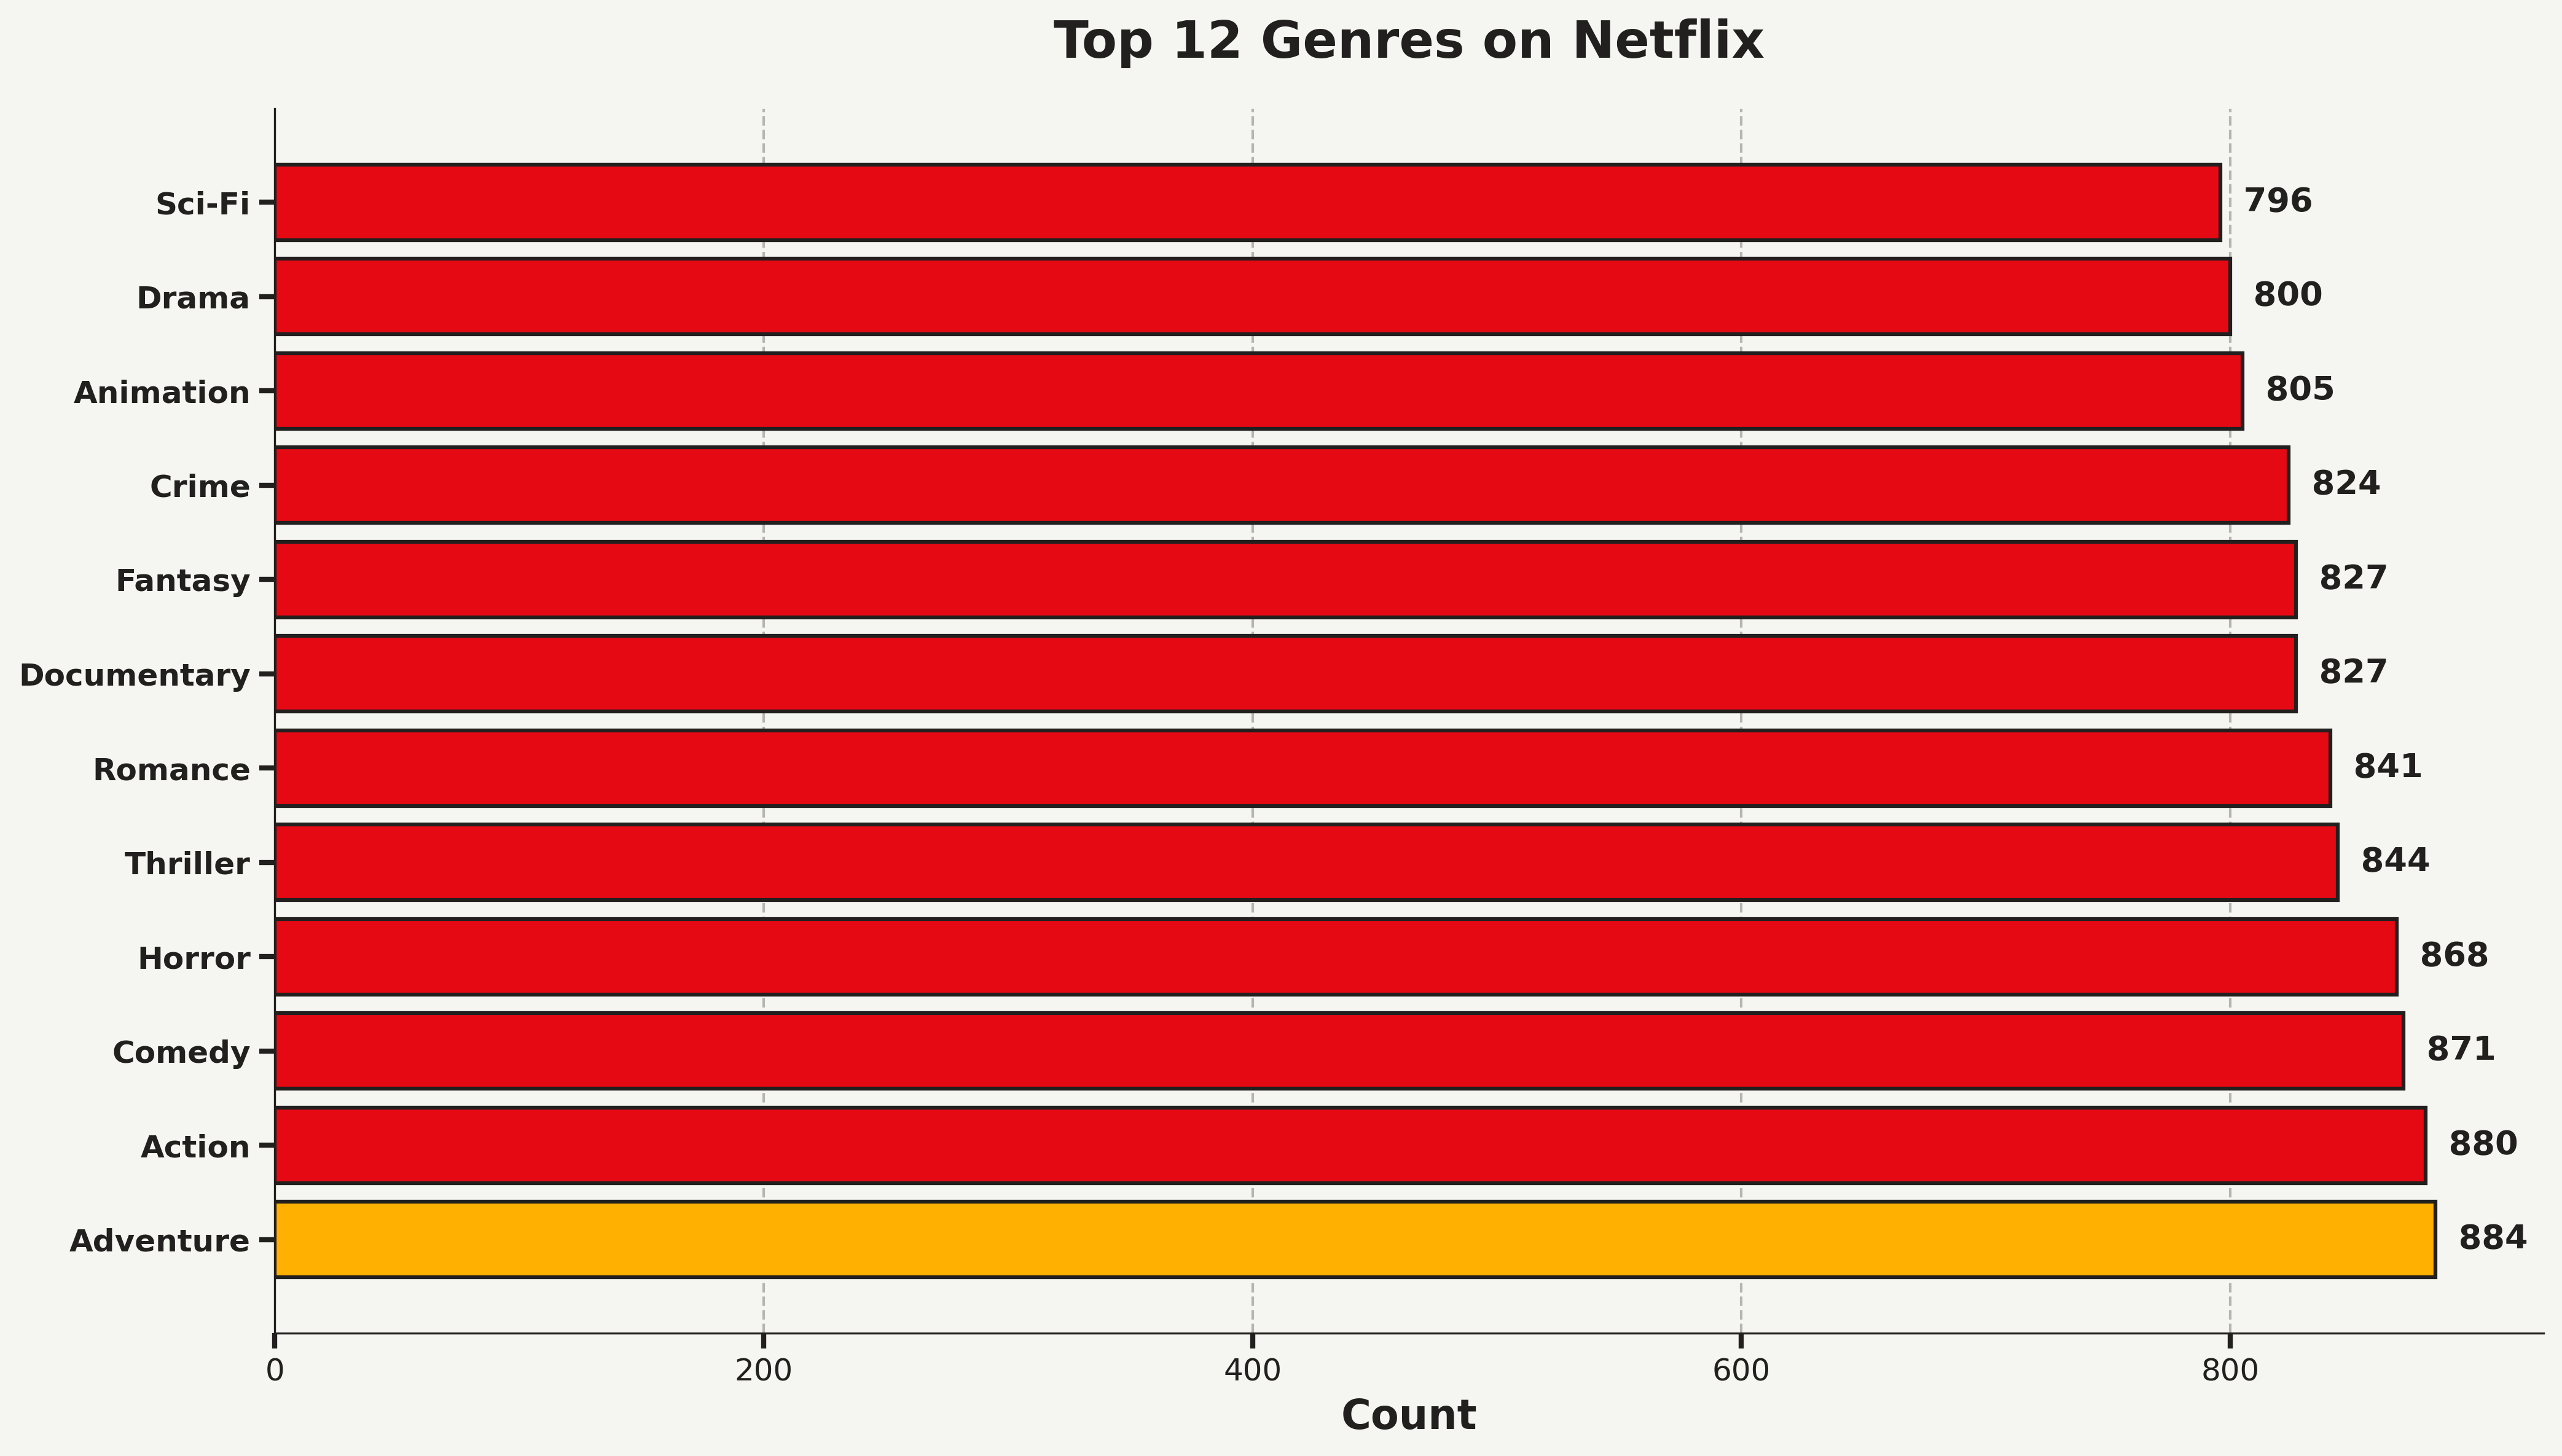
The most popular content genres on Netflix. Understand which types of shows and movies dominate the platform and attract the largest audience.
Top 12 Countries
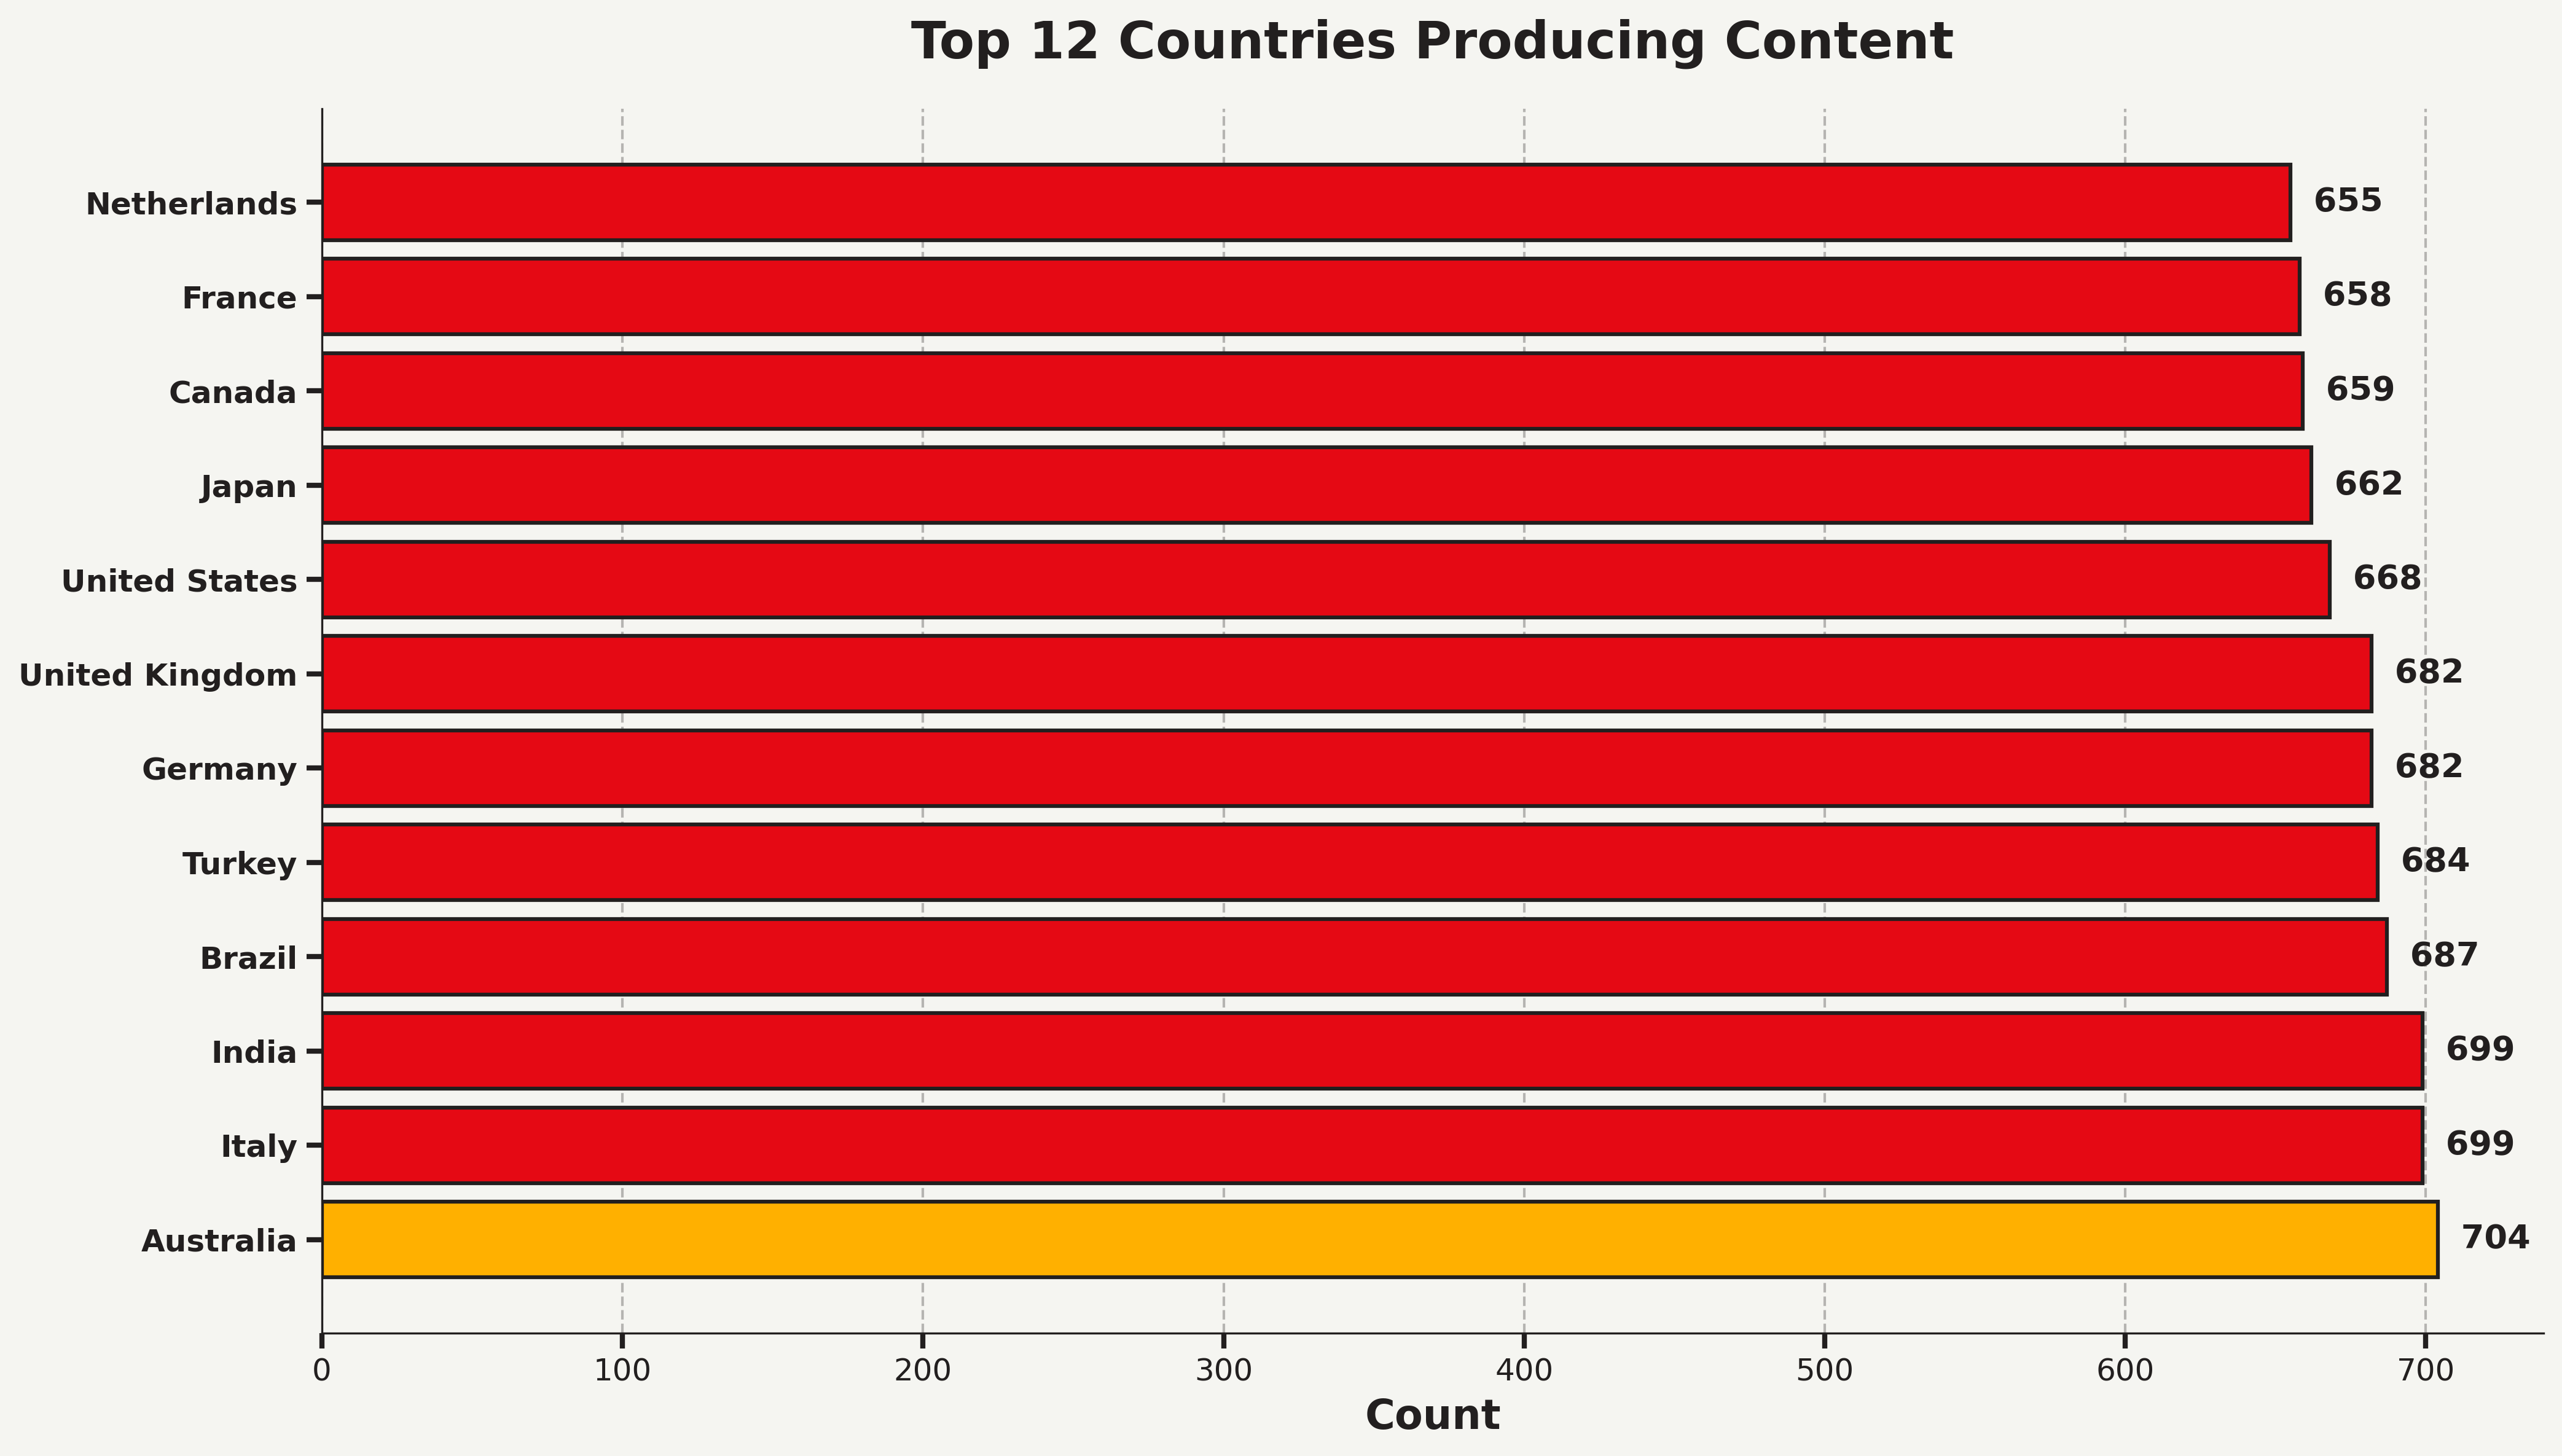
Which countries produce the most content for Netflix? This analysis reveals the geographical distribution of content creation and Netflix's global partnerships.
Content Details
Content Ratings
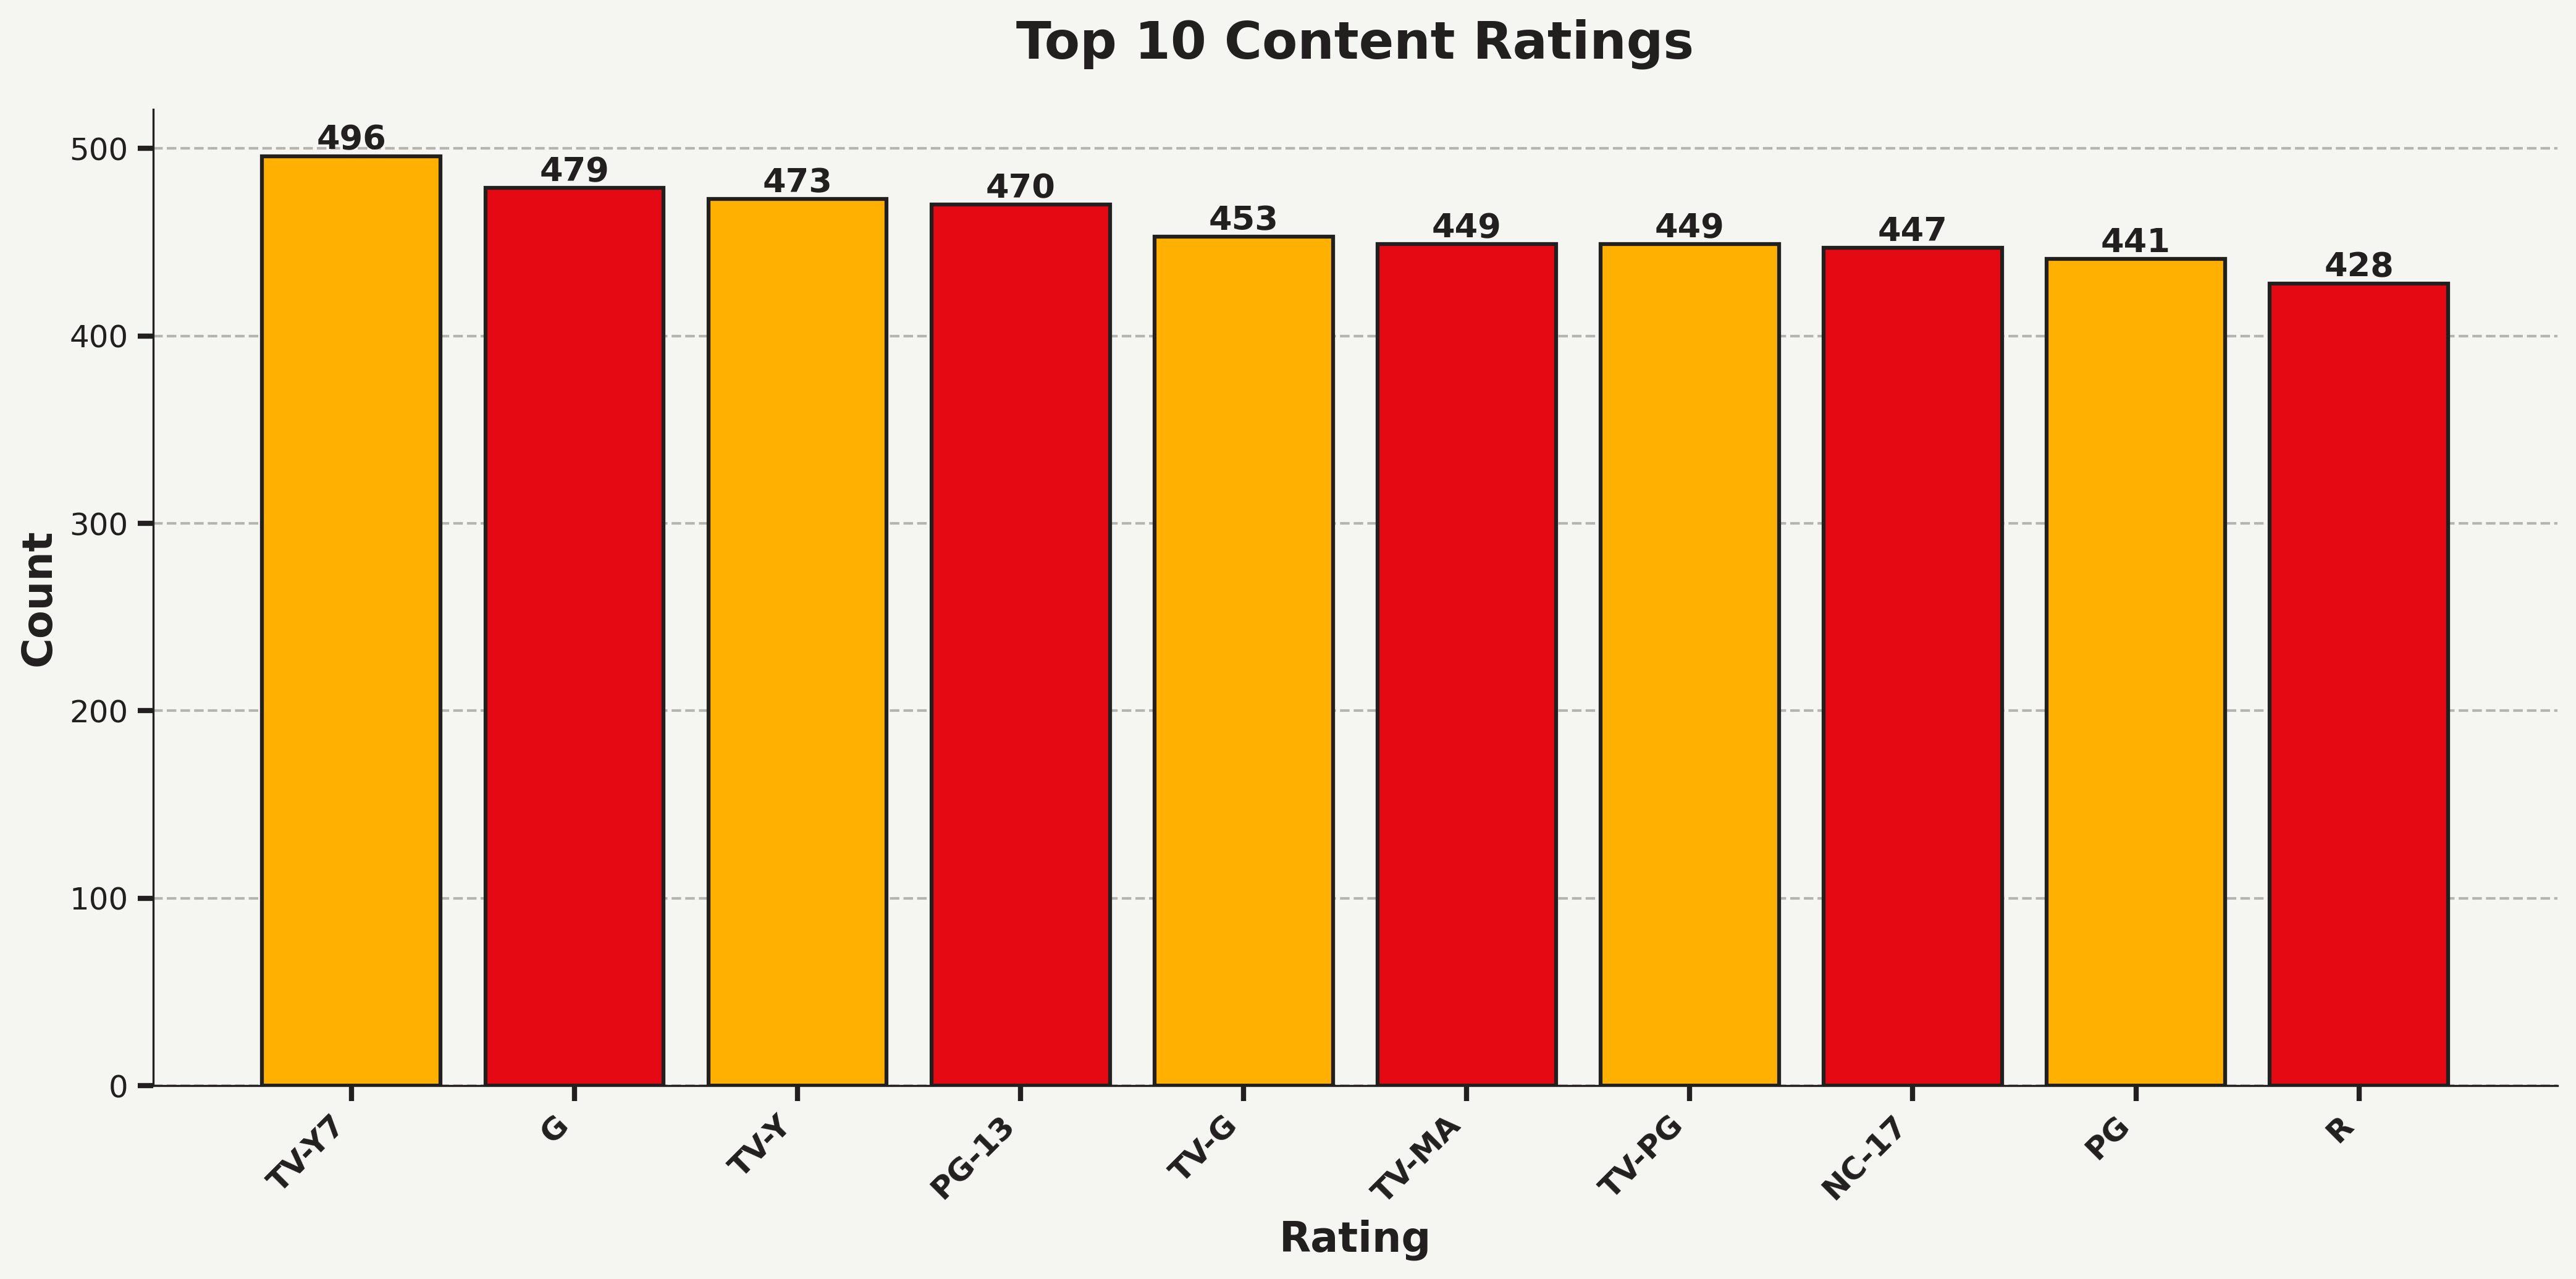
Distribution of content ratings (G, PG, PG-13, R, etc.) on Netflix. See how Netflix balances content for different age groups and audiences.
Duration Analysis
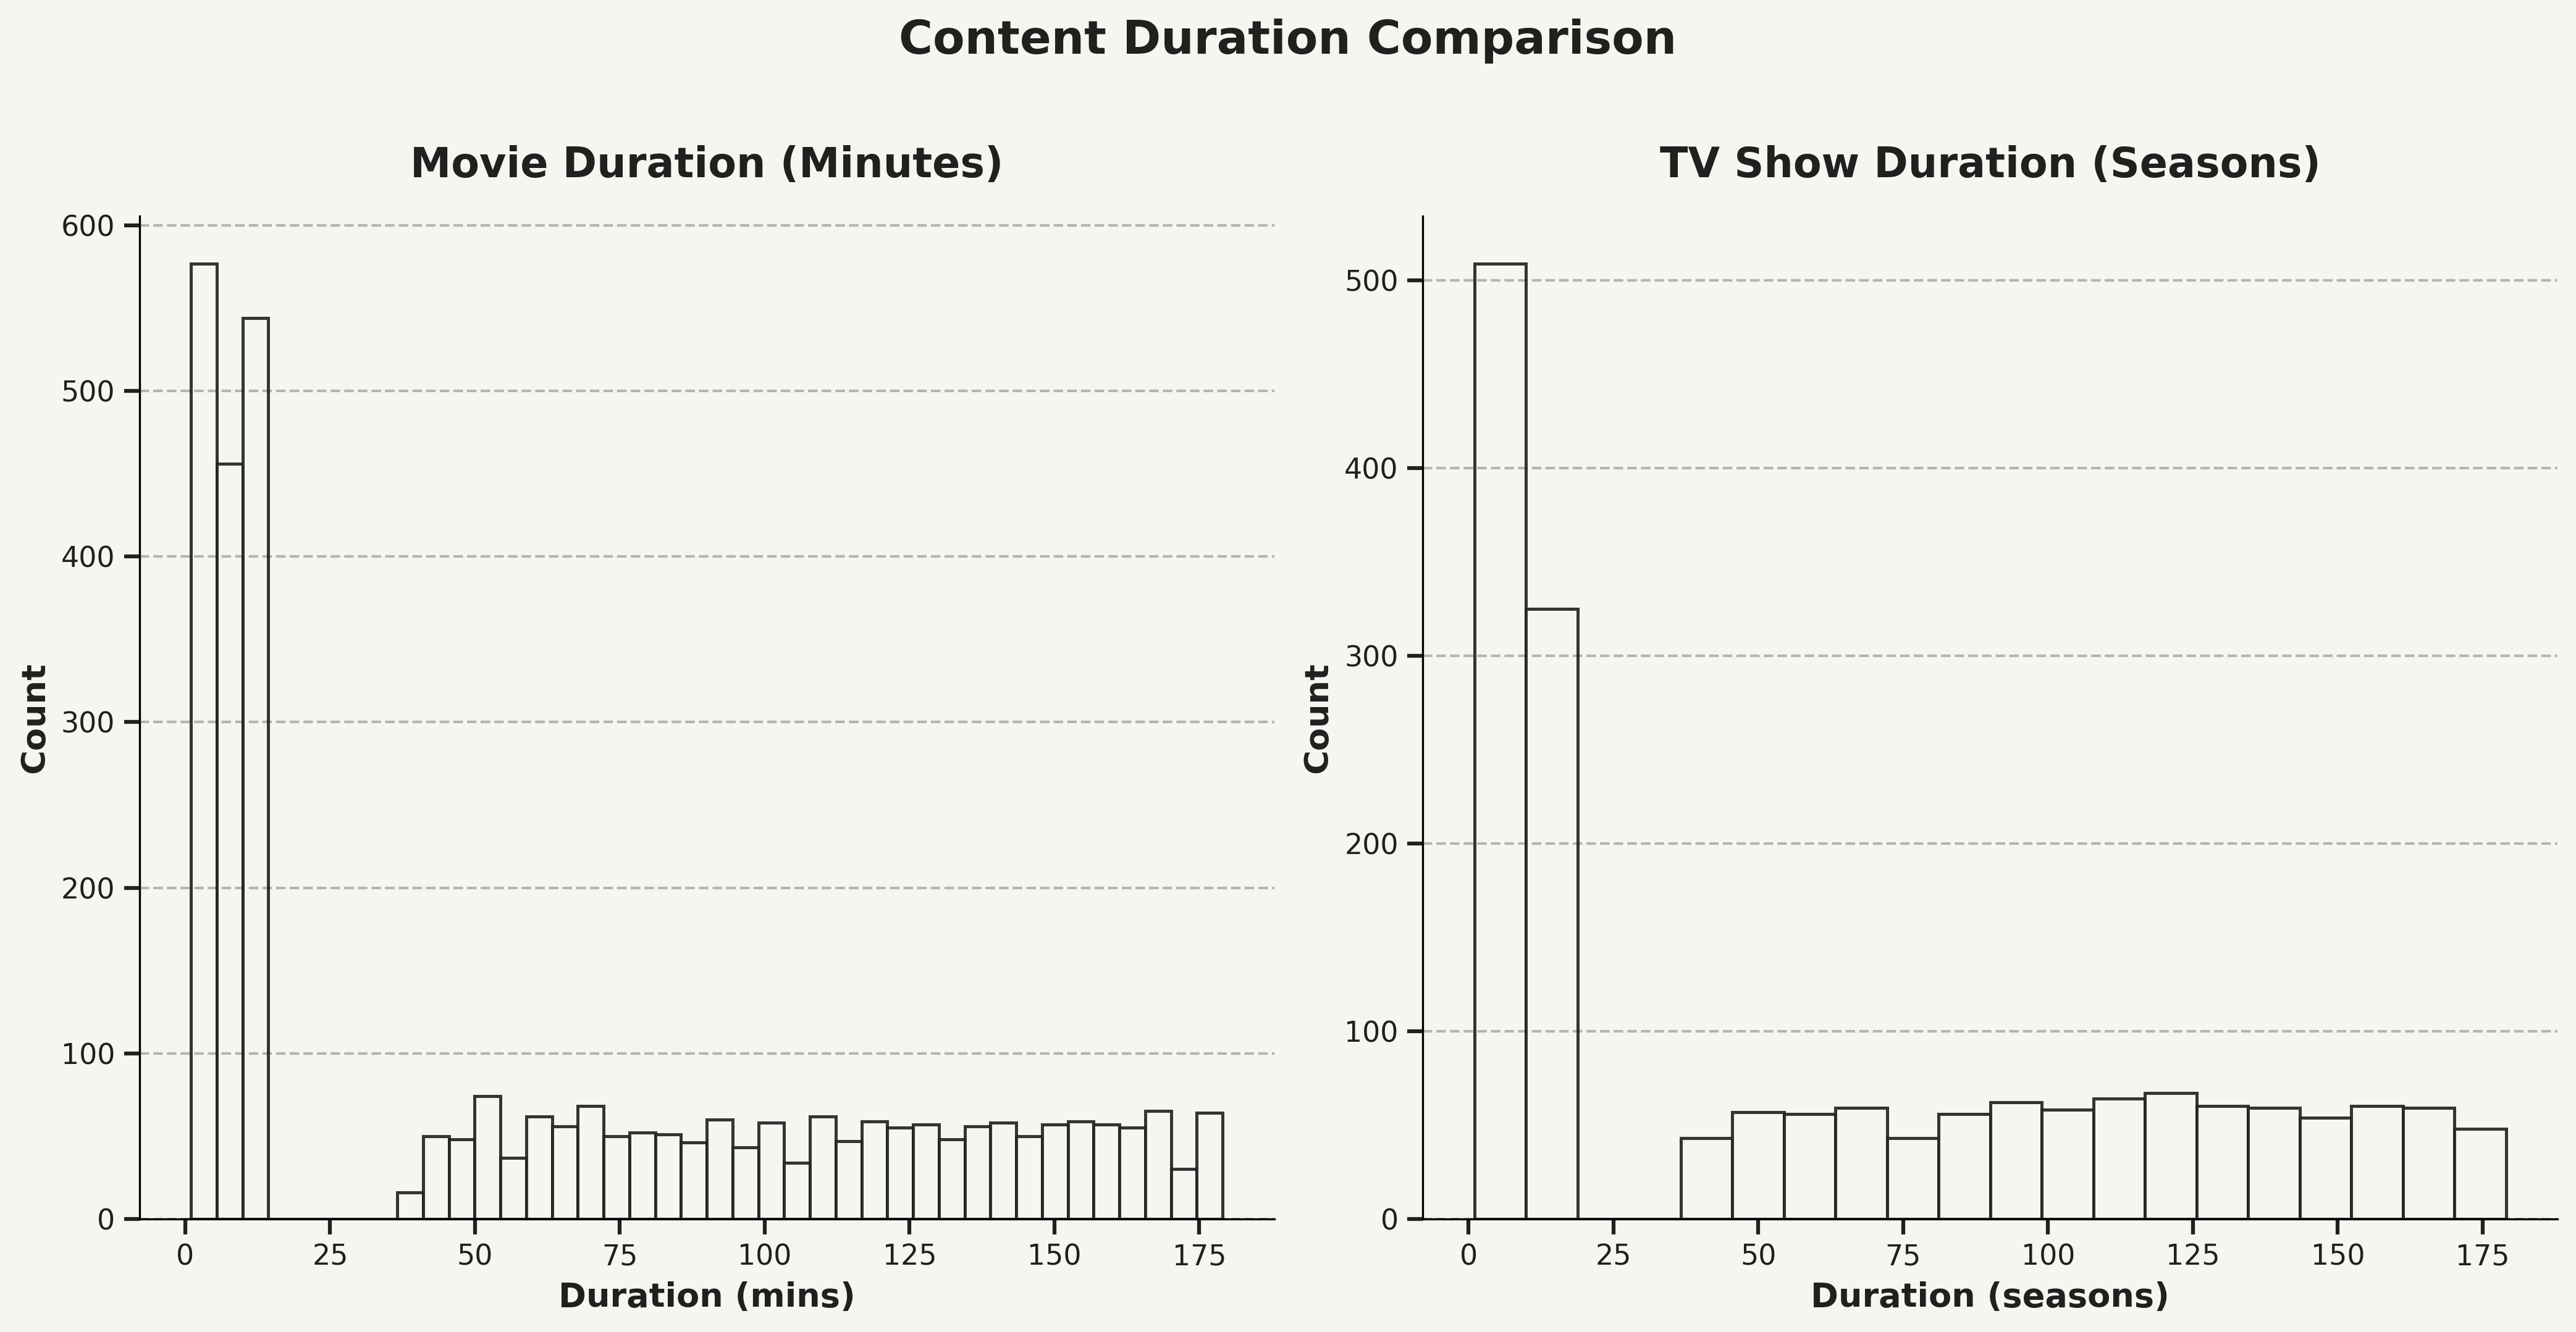
Compare the duration patterns between movies (in minutes) and TV shows (in seasons). Understand Netflix's typical content length strategy.
Growth Timeline
Content Added Over Time
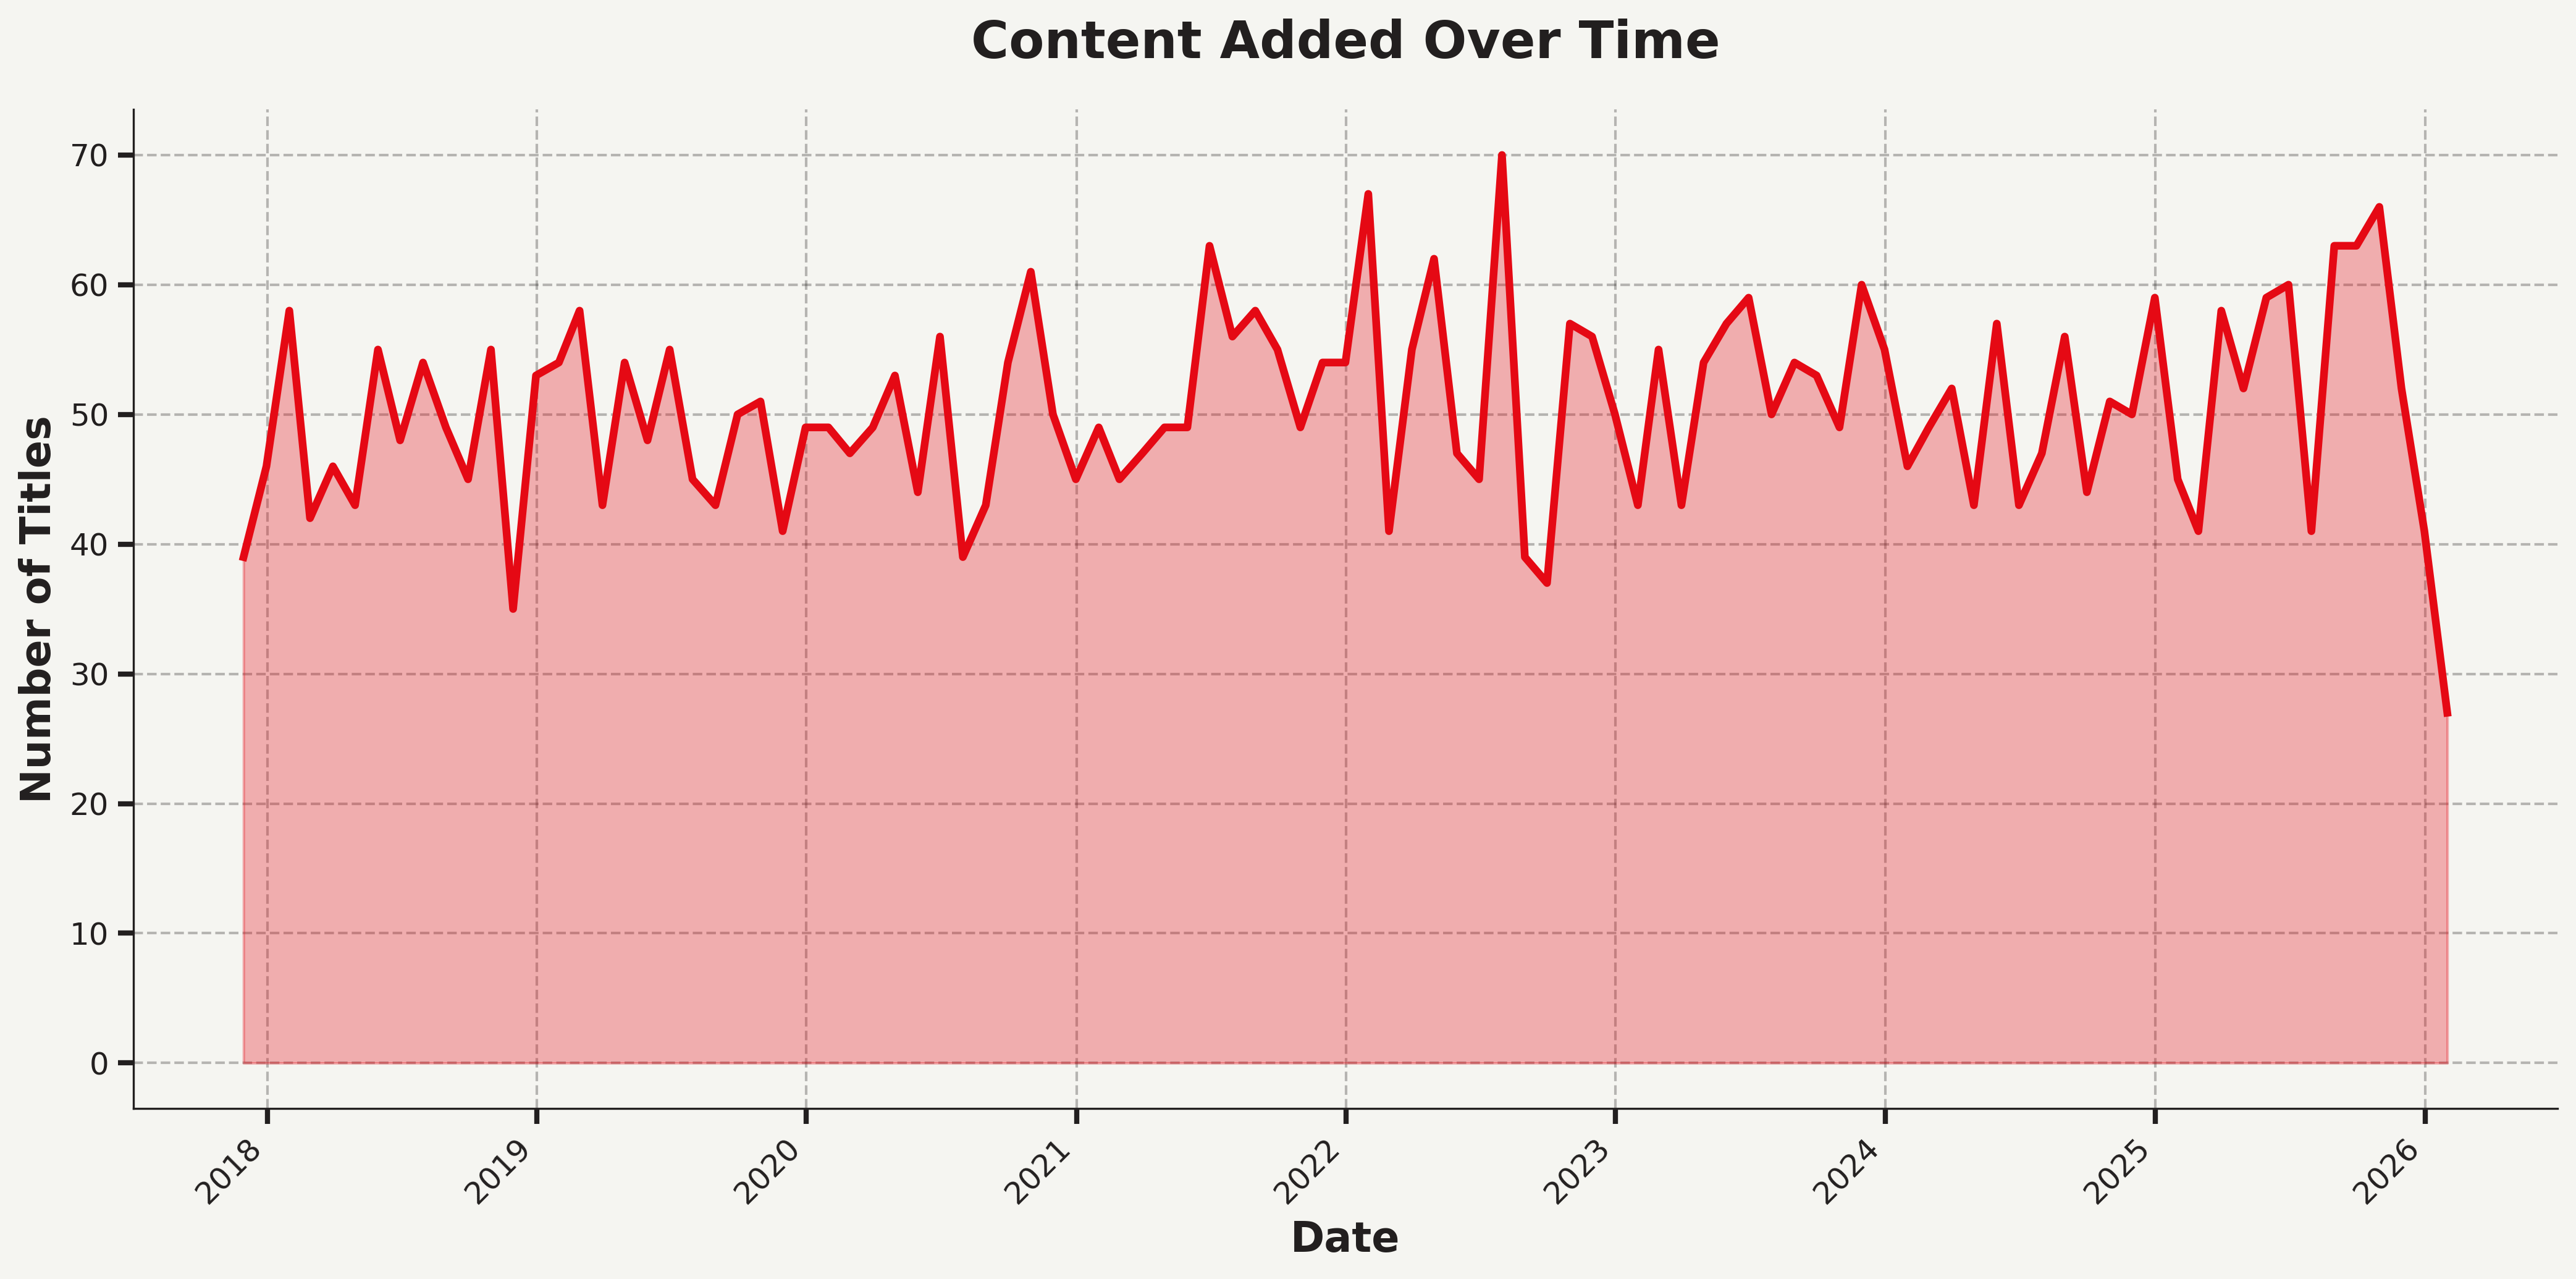
Track Netflix's content growth over the years. This timeline shows how Netflix has expanded its library and reveals periods of aggressive content acquisition.